Eurocode 8 Part 1 (IS:EN 1998-1:2005) requires a defined ground model for seismic design, and in Balbriggan, the shallow Balbriggan Limestone Formation makes that model particularly tricky to pin down with boreholes alone. The limestone here is Lower Carboniferous, tightly folded and faulted, which means bedrock can drop from two metres to twenty across a single housing estate. Seismic tomography, using both refraction and reflection acquisition, gives the continuous P-wave and S-wave velocity cross-sections that spot those abrupt transitions. The survey crew typically lays out a 115-metre spread with 24-channel geophones, and the first-break picks feed a tomographic inversion that resolves the overburden-bedrock interface with vertical accuracy around half a metre. MASW surveys can complement the refraction data when a Vs30 profile is needed for site classification, and a resistivity survey often helps discriminate saturated clays from intact limestone where the velocity contrast is ambiguous.
When limestone bedrock can plunge ten metres across a single foundation footprint, seismic tomography turns a guessing game into a measured cross-section.
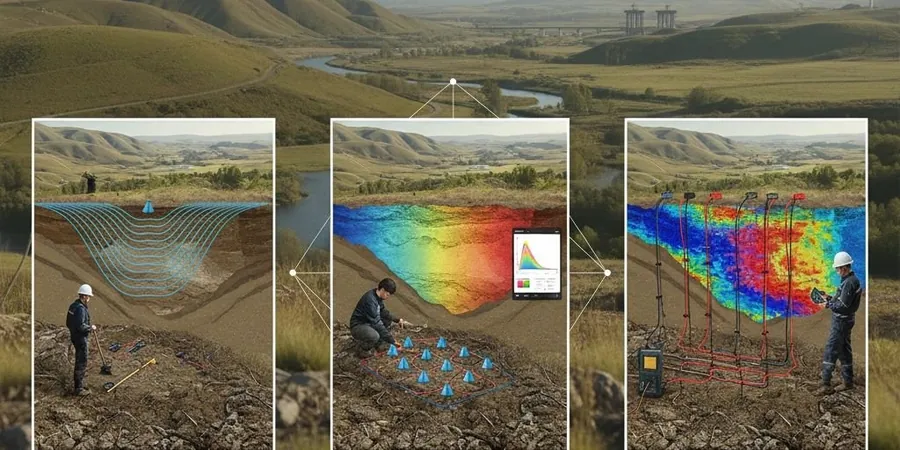
Methodology applied in Balbriggan
Risks and considerations in Balbriggan
The contrast between the harbour-side ground near Balbriggan Pier and the higher residential plots off Hamlet Lane is stark. Down by the coast, marine clays and estuarine silts blanket the limestone, often producing seismic velocities below 600 m/s for the uppermost five metres; these soft soils amplify ground motion and push the site toward a Eurocode 8 Class D or even S1. Up on the elevated terraces, the till is stiffer, with shear-wave velocities in the 300–500 m/s range, but the limestone is closer to the surface and riddled with solution features that can collapse under dynamic loading. A seismic tomography campaign captures both hazards: the low-velocity overburden that governs amplification, and the irregular bedrock surface that controls differential settlement. Skipping the survey on a Balbriggan site that straddles both terrains means designing to an assumed ground model that might miss a ten-metre step in competent bearing strata, and that kind of oversight shows up as structural distress within the first five years.
Our services
Seismic tomography in Balbriggan is not a one-size-fits-all product. The method is adapted to the specific question the ground is asking, whether that is bedrock rippability, cavity detection, or stiffness profiling for seismic design. Three configurations cover most site investigation briefs.
P-Wave Refraction Tomography
The workhorse for mapping overburden thickness and bedrock topography across Balbriggan's limestone. A 24- or 48-channel spread records first arrivals, and the inverted velocity model is interpreted against local borehole control to distinguish weathered rock from competent limestone.
S-Wave Reflection Profiling
Focused on the upper fifteen metres, this configuration uses horizontal geophones and a shear-wave source to produce a high-resolution Vs section. The deliverable feeds directly into site classification and liquefaction-potential assessments under Eurocode 8.
Combined Refraction & MASW Survey
On larger residential or commercial schemes, the seismic spread is recorded with both vertical and horizontal geophones so that P-wave tomography and MASW dispersion analysis run from the same dataset. The output includes Vs30, fundamental site period, and a layered stiffness model for structural design.
Frequently asked questions
Can seismic tomography reliably detect caves and dissolution features in the Balbriggan Limestone?
It can, within resolution limits. A dry, air-filled cavity produces a strong velocity contrast against competent limestone – typically dropping from above 3,000 m/s to below 1,200 m/s – and the tomographic inversion flags it as a distinct low-velocity anomaly. Clay-filled pipes are subtler because the velocity contrast is smaller; in those cases the crew may tighten the geophone spacing to three metres or run a parallel resistivity line to improve the interpretation.
How much does a seismic tomography survey cost for a typical residential site in Balbriggan?
For a standard single-house plot with two orthogonal lines totalling around 200 linear metres, the survey, processing, and report generally run between €2,840 and €4,080. The spread depends on access conditions, the number of shots per line, and whether both P-wave and S-wave data are required.
How long does it take to get results after the field crew finishes?
Field acquisition on a two-line survey takes one day. Processing – first-break picking, tomographic inversion, and interpretation against available borehole logs – requires three to five working days. The draft cross-sections are usually shared within a week, with the signed report following a few days later.
What is the difference between seismic refraction and reflection tomography for a Balbriggan site?
Refraction tomography images velocity gradients and continuous interfaces like the overburden-bedrock contact, using the first arrival times that travel along the refracting boundary. Reflection tomography captures sharper impedance contrasts – think fault planes or the roof of a cavity – by processing later-arriving reflected energy. On Balbriggan's folded limestone, running both modes on the same spread gives the most complete picture of the subsurface.